|
|
 |
| DR8 |
|
|
|
| Astronomy | ||
 | ||
| Mapping the sky | ||
| - Why survey? | ||
| - Ancient Surveys | ||
| - Modern Astro | ||
| - 20th Cent. Surveys | ||
| - The SDSS | ||
| Stars and Nebulae | ||
| Galaxies and QSOs | ||
| Cosmic Structures | ||
| Expanding Universe | ||
| Modern Cosmology | ||
|
Why do astronomers map the sky? This page gives a brief
introduction to their reasons, and outlines the history of astronomical
surveys, from ancient times to today. To learn more, visit your local library
or browse the many interesting sites on the Internet.
Why Survey The Sky?
For millennia, humans have wondered about the universe
outside of our world. The stars and planets, mere points of light in the night
sky, have always piqued our curiosity as we have sought to
understand our place in the cosmos.
To the ancients, these points of light were often viewed in connection
with higher powers beyond their control, such as gods and goddesses. Some
civilizations began to realize that certain celestial events repeated at
regular intervals. These civilizations used these regular events to mark time,
helping with agriculture and religious observances. Later, sky charts, produced
with naked-eye observations, became essential tools for navigation and trade.
(This important aspect of sky surveys survives today, with examples like the
U.S. Naval Observatory.)
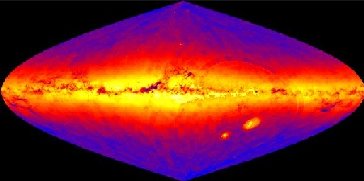
Today, we understand that the universe consists not only of stars and planets, but also of galaxies, clusters of galaxies, streams and clumps of gas, and a component of unseen (or dark) matter. To learn more about these objects, we must first know where to find them, how they interact, and how they change over time. Many structures cover large areas of sky; others are so rare that we must look at millions of objects to find just one example. These ideas have guided the many projects in the last century to map the universe, over ever-larger areas, to ever-greater depths, and over an ever-increasing range of wavelengths. Complete, scientific sky surveys are the best technique we have for discovering new objects and interactions of objects. Once we find enough objects, we can study them to derive the basic physical properties of the universe.
This survey, the Sloan Digital Sky Survey (SDSS),
was created to study how galaxies cluster on the largest scales. The SDSS will map these
clusters in greater detail than any survey so far. If we know how galaxies cluster, we can
learn something about how microscopic matter and energy variations evolved from
the earliest moments after the big bang, more than 12 billion years ago, into
the structures we see today.
Ancient Surveys
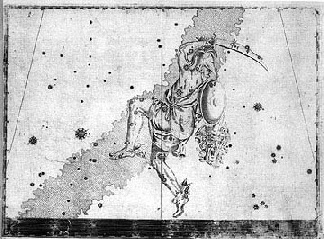
Astronomy is the oldest of the physical sciences. It developed in
ancient times from curiosity about day and night, the sun, the moon, and the
stars. At night, more than 1000 visible stars followed a similar course,
appearing to rotate in permanent groups, or constellations, around a fixed point
in the sky called the north celestial pole. The earliest sky surveys were records of
the positions and motions of stars and planets. People in ancient Egypt, China, Central
America, and Mesopotamia conducted these surveys over 5,000 years ago. They recorded their
data on stone tablets or temple walls, and sometimes they even built giant structures like
Stonehenge that aligned with specific astronomical events. The first known star catalog,
containing 800 stars, was created in China in about 350 B.C. by Shih Shen.
Maps of the universe improved dramatically from 600 B.C. to 400 A.D. During this
period, Greek philosophers and astronomers began to develop theories of the workings
of the cosmos. These theories, based on detailed observations, made predictions for
the motions of the Sun, the Moon, and the planets. In the 6th century B.C.,
the Greeks introduced geometry into astronomy. A hundred years later, the famous
mathematician Pythagoras theorized that the planets moved along the surfaces
of concentric spheres. In the 4th century B.C., Aristotle summarized Greek
astronomical knowledge and Aristarchus calculated the sizes of the Sun and Moon relative
to the Earth.
Two hundred years later, Hipparchus developed trigonometry. With trigonometry, he could
calculate distances to planets and stars by knowing the angle from which they were
viewed on Earth. Hipparchus recognized that astronomy requires accurate and systematic
observations extended over centuries, so he used many old observations along with his own.
In addition, he intended for many of his observations, especially his observations of
the planets, to be used by future astronomers.
Hipparchus's idea of how the planets moved was later refined by Ptolemy, and became
what we now call the Ptolemaic system. In the Ptolemaic system, the planets moved
in concentric circles around the Earth, while some planets moved in smaller circles called
epicycles around their main orbits. The Ptolemaic system predicted the
planets' motions with great accuracy. Ptolemy also used trigonometry to
accurately measure the distance to the moon. His 13-volume treatise, the Almagest,
summarized much of ancient astronomical knowledge. It was translated into many
languages, and it became the authority for astronomical questions over the next
1,400 years.
Modern Astronomy is Born
Astronomy was dormant in Europe for more than 1,000 years. During this time,
Islamic and Hindi astronomers made significant progress in understanding the sky.
European astronomy began to be revived as the works of the ancient Greeks returned
through Arabic translations. The revival was ensured by a Polish priest named
Nicholas Copernicus, whose 1543 book De Revolutionibus Orbium Coelestium
(On the Revolutions of the Celestial Spheres) proposed that the Earth rotates
on its axis and revolves around the Sun, along with all the other planets. During this
time, astronomical observatories were established in Europe. One of these observatories,
Uraniborg, was located on a Danish island. There, the famous astronomers Tycho
Brahe and Johannes Kepler compiled the most accurate and complete astronomical
observations to that time, containing over 700 stars.
At the same time, Galileo Galilei, often called the founder of modern science,
pointed a newly-invented telescope at the night sky. The telescope revolutionized
astronomy by allowing astronomers to see stars that no one had ever seen before. In the
1600s, Isaac Newton developed the Theory of Universal Gravitation, which said the same
force that makes objects fall to earth makes the planets orbit the Sun. By the
1700s, astronomers regularly used Newton's laws to provide a physical basis of
what they saw. Kepler's observations and Newton's laws were the basis for
astronomy for nearly two hundred years.
20th Century Surveys
In the late 1800s, astronomy was revolutionized again by the invention of the
camera and the spectrograph. Photographic films and plates allowed astronomers,
for the first time, to create a permanent record of the sky. In addition,
photographic plates could be exposed for long periods of time, allowing astronomers
to see fainter objects at greater distances. By the 1930's, astronomers knew that
many of the faint, fuzzy objects they saw were actually other galaxies that
contained trillions of stars. But to study distant galaxies, astronomers first
had to find them. To find more faint galaxies, astronomers began taking systematic
photographic surveys of the sky.
These systematic sky surveys were made easier by the development of the
Schmidt telescope, a new telescope that allowed large areas of the sky to be
photographed at once. The first such telescope, with mirrors 18 inches
(46 centimeters) across, began operating in 1936 at
Palomar Observatory
in California, and was used to search for exploding stars called supernovae. This
design was so successful that a larger, 48-inch (1.2-meter) version was built, and
used to spot objects for the new 200-inch (5-meter) telescope being built at Palomar.
Using the 48-inch Schmidt telescope, astronomers began the first modern effort at a
complete, unbiased survey in 1949. The National Geographic-Palomar Observatory Sky Survey
(POSS-I) collected data in different colors of light over the entire northern
sky. Another telescope was built to survey the entire southern sky.
These surveys required decades to complete, but they provided astronomers with
data they could use for decades. In the 1980's, as new telescopes were built,
astronomers began to need a new survey to find fainter, more distant targets for
the largest telescopes. Using the same 48-inch Schmidt telescopes at Mount Palomar,
but with improved photographic emulsions, astronomers began
the Second Palomar Observatory
Sky Survey (POSS-II), a new survey of the entire northern sky.
When computers and digital images were developed, astronomers scanned the plates
from the photographic surveys to create digital pictures that anyone could look at
over the Internet. Today, anyone can download images from any of these surveys using
tools like NASA's SkyView. In addition, with
the development of astronomical observatories at other wavelengths
(radio:FIRST,
X-ray:RASS,
infrared:2MASS),
surveys of the sky in these new windows were immediately undertaken,
revealing amazing views of the sky never before seen.
The Sloan Digital Sky Survey
Today, modern electronic detectors (like the CCD chips in digital cameras) provide much
greater sensitivity than photographic plates. Fast computers and large data storage
systems allow astronomers to take digital pictures of the sky, as well as to process and
store the data they collect. These technological advances led to the creation of the
Sloan Digital Sky Survey, which has mapped one-quarter of the entire sky in detail,
determining the positions and brightnesses of hundreds of millions of celestial objects. It
has also measured the distance to a million of the nearest galaxies, giving us
a three-dimensional picture of the universe through a volume one hundred times
larger than those we have now. The SDSS has recorded the distances to
100,000 quasars, the most distant objects known, giving us an unprecedented
view of the distribution of matter to the edge of the visible universe.
The portion of the universe that the survey will observe is represented by our
vaguely parachute-shaped logo. We are at the center of the logo, at the vertex of
the parachute strings. The elliptical background evokes the shape of a galaxy, the
celestial object of greatest interest to the SDSS.
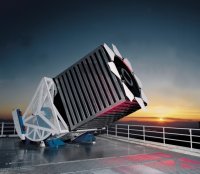
The SDSS uses a specially built 2.5-meter (8 feet) telescope at Apache Point Observatory in
New Mexico. The telescope is fixed to point directly up at the sky. As the Earth rotates,
more of the sky becomes visible above the telescope. Over the course of a night, the
telescope images a "stripe" of sky. The telescope operates on clear nights, and has imaged stripes over one-quarter of the night sky. The telescope images
the sky in five different wavelengths of light simultaneously; the five wavelengths are
shown in the table at right.
In addition to imaging the sky, the SDSS collects spectra, which measure how much light an object emits at different electromagnetic wavelengths. The SDSS has measured spectra for around one million galaxies. In the Northern Galactic Cap region, the SDSS has observed about 10,000 square degrees. In the Southern Galactic Cap, the SDSS has imaged the same strips of sky repeatedly, allowing us to see much fainter sources, and to search for variable and transient objects.
| |||||||||||||||||||||||||||||||