|
|
 |
| DR8 |
|
|
|
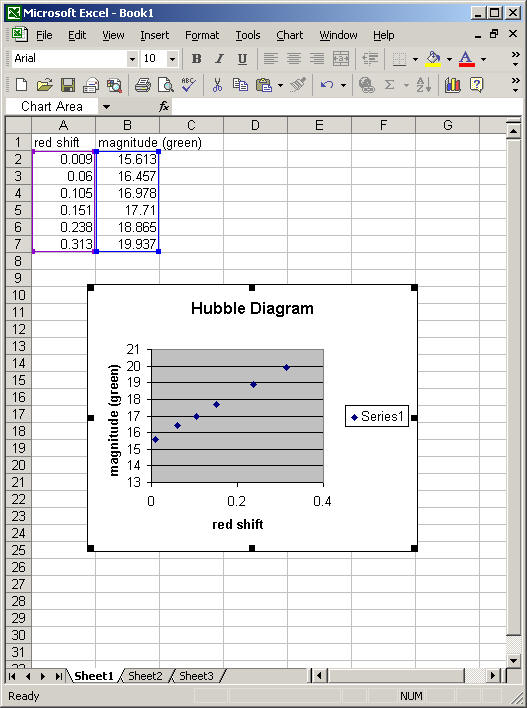
Fitting a Curve to DataExcel will allow you to find the equation for a curve that fits your data. The curve may be a line, quadratic, polynomial or several other types of functions. Let's fit a line to the Hubble Diagram.
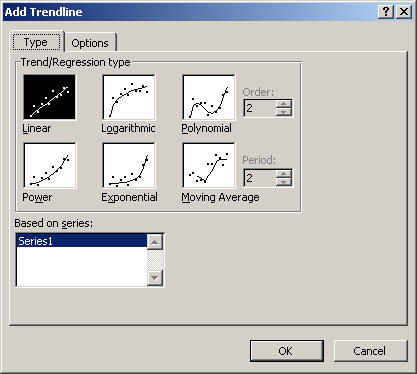
Click on the Chart menu and select Add Trendline. The following menu will appear:
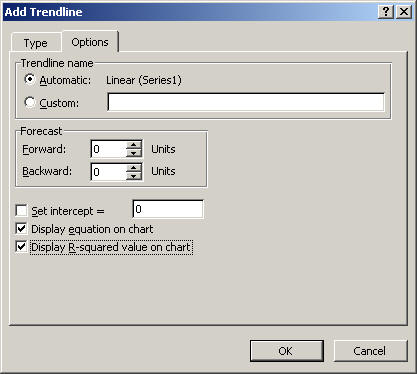
The points in the Hubble Diagram look like they form a line, so let's try a linear fit. Click on Options. We want the equation to appear on the graph, as well as the r-squared value (r-squared gives you an idea of how good the fit is).
Click OK on both boxes, and your graph will have a trendline added, along with the equation for the line of best fit.
An r2 value close to one indicates a very good fit to the data. A Word of Caution: If you choose linear, Excel will fit a line to any data you care to input, whether the data follow a linear trend or not. It is important that you think about what type of data you are plotting when you select the type of trendline. There are times when more than one type of curve will give a good fit to your data!
|

 |