Redshifts
In the last section, you used SkyServer to look up redshifts of twelve galaxies.
In this section, you will learn how to calculate redshifts for yourself.
Astronomers learn an amazing number of things from
analyzing spectra. In this section, you
will focus on just one application: you will learn how to measure the
redshift of a galaxy from its spectrum, and you will learn how to interpret
and use the redshift.
Measuring Redshifts
Measuring a redshift or blueshift requires four steps:
1) find the spectrum of something (usually a
galaxy) that shows spectral lines
2) from the pattern of lines, identify which
line was created by which atom, ion, or molecule
3) measure the shift
of any one of those lines with respect to its expected wavelength, as
measured in a laboratory on Earth
4) use a formula that relates the
observed shift to the object's velocity.
An example will help to show how this works. All spectral lines are created
when electrons move around inside atoms. Hydrogen
is the most common element in the universe, and it is often seen in
galaxies. The spectrum of a hydrogen-containing region shows a pattern of
spectral lines called the "Balmer series." The Balmer series
is easy to reproduce in a classroom with a hydrogen discharge tube. The
force that makes the gas glow is not the same as in galaxies, but the spectrum - the
pattern of lines - is the same. Either from your own measurements in the
classroom, or by looking the Balmer series up in a table, you know the rest wavelengths
of Hydrogen's spectral lines to be as follows: (The wavelengths are given in Angstroms, equal
to 100 trillionths of a meter)
Rest Wavelengths of Hydrogen - Balmer Series |
|
Name |
Color |
Wavelength (Angstroms) |
|
Alpha (a) |
Red |
6562.8 |
|
Beta (b) |
Blue-green |
4861.3 |
|
Gamma (g) |
Violet |
4340.5 |
|
Delta (d) |
Deep Violet |
4101.7 |
|
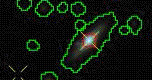
Exercise 12: Using
the Get Spectra tool, check out the spectrum of the object with ID = 587731512071880746.
You can find the spectrum in Plate 401/51788, Fiber 161, and it is reprinted below.
This spectrum comes from a galaxy, and like many others, it shows strong
spectral lines. The hydrogen lines are already identified for you: the tallest
peak is the a line (marked Ha),
the second tallest is the b line. The
g and d lines are
valleys instead of peaks. |

|
Click on the image to see it full size |
|
|
Read off the wavelengths of the Balmer lines on the x-axis of the
spectrum to verify the entries in this table:
|
Wavelengths of Hydrogen - Balmer Series for
Object ID #
587731512071880746 |
|
Name |
Color |
Wavelength (Angstroms) |
|
Alpha (a) |
Red |
7220 |
|
Beta (b) |
Blue-green |
5360 |
|
Gamma (g) |
Violet |
4780 |
|
Delta (d) |
Deep Violet |
4500 |
|
The redshift is symbolized by z. The definition of z is
1 + z = l observed / l
rest.
For example, taking the Balmer gamma line of galaxy 587731512071880746,
1 + z = 4780 / 4340.5 = 1.1, so
z = 0.1.
If the observed wavelength were less than the rest wavelength, z would be
negative - that would tell us that we have a blueshift, and the galaxy is
approaching us. But it turns out that only almost every galaxy in the sky has
a redshift in its spectrum.
Choosing the alpha, beta, or delta lines would also
give approximately z = 0.1 - the measured redshift does not depend on which line you
choose. If you get very different redshifts when you use different lines, then you probably have not correctly
identified at least one of the lines.
Interpreting Redshifts
Sometimes we instead want to express a galaxy's redshift as
the speed with which the galaxy moves away from us, in units of km/sec.

To convert from redshift z to velocity v measured in kilometers per second,
the formula is
v = c z,
where c is the speed of light, c = 300,000 km/sec.
Thus, in this example, galaxy 587731512071880746 appears to be moving
away from us at about 30,000 km/sec. This value is
typical of the galaxy redshifts found in the SkyServer database.
Since the formula can be rewritten as
z = v / c, it shows you how to interpret z:
z measures the galaxy's speed away from us relative to the speed of light.
Up to this point things are straightforward, but this definition of z
is tricky for two reasons. First, the formula v = c z is accurate only when
z is small compared to 1.0 (0.1 would be OK in this sense). For high velocities,
those that approach the cosmic speed limit - the speed of light - Einstein's
Special Theory of Relativity says that a more complicated formula is needed.
Second, while we often speak of the "motion of the galaxies," which implies
motion through space, in fact the picture is that space itself is expanding.
The galaxies are not moving through space, but just being carried along by
space as it expands (see the Conclusion for more about this concept). In this picture, the
redshift of a galaxy is not supposed to be interpreted as a velocity at
all, even though the observed redshift looks just like a Doppler effect redshift.
Rather, the redshift tells us the size of the universe at the
time the light left the galaxy. Because the universe is billions of light-years
across, it takes billions of years for light from distant galaxies to reach us.
Suppose the distance to galaxy
587731512071880746 was
d(z) at the time the light left it that we are
now observing (for z = 0.1, this time was
roughly a billion years ago). In those billion years, the space in the
universe has expanded, so that now the distance between our galaxy and
it is d(0). Then
1 + z = d(0) / d(z).
We interpret this formula to mean this: at the time corresponding to
redshift z = 0.1, all galaxies in the
universe were 10% closer together. A measured value of z = 0.2
corresponds to a time when galaxies were 20% closer together than
they are now, and so on.
|
Exercise 13: Not all galaxies have spectra
with strong Balmer series hydrogen peaks, as galaxy 587731512071880746 does.
To help recognize
more complicated patterns of lines seen in galaxies, astronomers use
a set of example spectra of galaxies that seem to be examples
of classes. Galaxy classes include those with strong peaks,
those with no peaks but deep valleys, and galaxies with moderate amounts of
both.
Astronomers can
match these examples, called template spectra, to the spectra of galaxies at
unknown redshifts, then move the unknown spectra to find the redshifts. The SDSS uses
nine template spectra.
The application below lets you use SDSS's templates to find the
redshifts of ten galaxies. Select the spectrum you wish to look at with the
drop-down menu labeled "spectrum." Select the template you wish to compare it to
with the drop-down menu labeled "template." Compare each spectrum to the
nine templates to find the one it most resembles (the spectrum is blue
and the template is yellow). Then, use the left, right, step
left (<<) and step right (>>) buttons at the bottom of the page
to move the unknown spectrum left and right. Above the spectrum, the
application shows the redshift you are testing.
When the peaks and valleys of the unknown spectrum match with the peaks and
valleys of one of the templates, you have found the redshift of the unknown spectrum.
Don't try to match the entire spectrum perfectly; just get the major peaks and
valleys to match. When you find the redshift that matches the spectrum most closely,
write the spectrum number from the drop-down menu, then write the redshift you found.
Start the application |
Redshifts of Sample Galaxies
Now that you know what redshift is and how to measure
it, you are ready to return to the sample galaxies from the last
section.
|
Exercise 14: Open your online notebook
containing the galaxies you found relative distances to in the last section.
Of the objects you selected, at least four should have spectra available in the
SDSS spectra database. In fact, these four were among the ten galaxies you found
redshifts for in the last exercise.
The table below tells you which spectrum number from Exercise 13 corresponds
to which galaxy's object ID from the Distances section. Click any
of the object IDs to open the Object Explorer in the tools window.
Write down the redshift (the "z" just above the spectrum) for each
galaxy.
Compare the redshifts found by the SDSS with the redshifts you
calculated in Exercise 13. How close were you?
|
|
Exercise 15:
What is the average redshift of the galaxies in Exercise 14?
What is the average redshift in the SkyServer database? To find out, pick a few dozen
galaxies at random from the database. Find the average redshift and the
range of redshift values. Do the same for objects
classified as quasars - what is their mean redshift, and what is the
range?
The easiest way to look at many spectra at once is to use the
Plate Browser tool (the link will open in the tools window). This tool
lets you look at the 640 spectra that the SDSS's spectral plates observe
in a single night. (See
About SDSS: Spectrographs for more on how the plates work.)
Select any plate from the dropdown menu. Below the menu, you will see
640 links, labeled with object type (star, galaxy, or quasar) and redshift.
When you click a link, you will see the spectrum of that object.
Click on several links at random. Write down the redshifts of about 20 to
30 galaxies, then about 20 to 30 quasars. Find the average redshift from
these data. |
|