|
|
|
|
||||
|
|
|
|
||||
| DR9 Tools | ||
 | ||
| Getting Started | ||
| Famous places | ||
| Get images | ||
| - Fields | ||
| - Spectra | ||
| - Plates | ||
| Scrolling sky | ||
| Visual Tools | ||
| Search | ||
| Object Crossid | ||
| CasJobs | ||
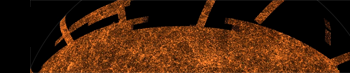
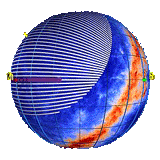
The images from the SDSS project are organized into stripes. These are long images, 24,000 pixels (2.5 degrees) wide, and typically over 1 million pixels (120 degrees) long. The SDSS covers the northern sky with overlapping stripes. Each stripe is merged from two runs, taken on separate nights. The telescope can complete only a single 8-hour run in any given night. Each run consists of 6 camcols (camera columns); one camcol corresponds to each array of CCD detectors of our camera. Each camcol takes images in five colors, from the ultraviolet to the infrared.
|
|
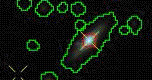
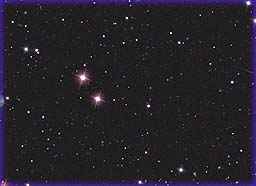
We have created color images by taking the middle three bands and assigning those to the blue, green and red channels of the screen. The 1 million pixel long camcols are broken up into many fields. Each SDSS field is 2048 pixels wide by 1489 pixels high. The fields overlap along the scan direction by 128 pixels. The fields can be uniquely named by the run number, the camcol and the field number. The images of the fields can be downloaded by clicking on Fields at the sidebar. |
 |
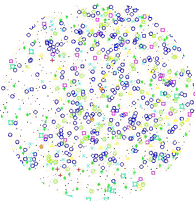
The SDSS project uses the color images to detect millions of objects (over 300 million stars and galaxies) over the whole northern sky. As soon as these objects are observed, a sophisticated software algorithm selects targets for further studies. Using another instrument, we take detailed spectra, measurements of the energy given off by the object as a function of its wavelength. An object's spectrum tells much more about an object than its image. A spectrum can be used to estimate a galaxy's distance and chemical composition, or to determine a star's age. |
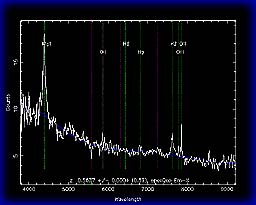 |
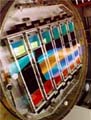
Our system can measure 640 spectra simultaneously over a 3 degree wide area, using a spectral plate. Each plate is an aluminum disc with 640 optical fibers connected; each fiber points to an object we are observing. By clicking on Spectra at the sidebar, you can download a picture of the spectrum of every object observed spectroscopically. By clicking on Plate you can browse through a list of all objects from a given plate, by type and redshift, and look at them individually by clicking at them. |
 |