|
|
 |
|
|
|
|
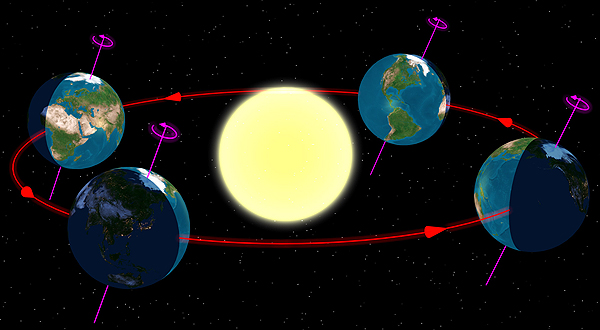
The diagram below is a computer-generated image that depicts the positions of the Sun and Earth during each season. You can see that the Northern and Southern hemispheres of the Earth receives different amounts of light from the Sun during different seasons.
So far, all the maps you have made have been in RA and Dec coordinates - that is, from the Earth's perspective. But you can also make maps from the Sun's perspective. The next page tells you how to make these maps. Click Next if you're curious about what these maps look like! |
||
|
|
||
|
|
||


|
||
|
Seasons image from Wikipedia article, under Creative Commons license. Created by user "Tau'olunga". Links open in new window. |