Explore 3. Make graphs of the positions of asteroids on September 22nd, 2006. Make graphs of different numbers of
asteroids - 10, 500, 1000, and so on.
Use a spreadsheet program to make the graphs. Here are instructions about how
to make the graphs in Excel (link opens in new window).
If you don't have Microsoft Excel, try one of the following spreadsheet programs (links open in new windows):
OpenOffice (all operating systems)
Sphygmic Spreadsheets (Windows only)
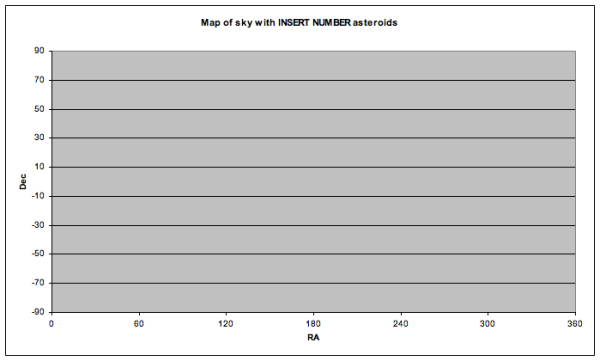
Put RA on the x-axis and Dec on the y-axis. Again, make sure your graph is twice as long as it is wide. The shape and axes of the graph
should look like this:
|